Beyond the numbers: What updated population data reveals about our changing nation
South Africa’s demographic landscape is evolving rapidly, driven by urbanisation, migration, economic shifts and changing social norms. To track these dynamic changes, researchers and policymakers rely on comprehensive datasets which provide regular updates on population characteristics, household structures and living conditions.
Staying current with these demographic trends through reliable data is essential for data driven decision making, planning and insights provision. Eighty20, South Africa’s leading consumer strategy, research and analytics consultancy uses these datasets (available on the Data Portal) to help their clients find growth in uncertain times.
|
One recently updated dataset is the StatsSA 2025 Mid-Year Population Estimate, which puts the current population at an estimated 63.1 million. The dataset is one of many that helps track the demographic movements that will affect our country’s future. Yet under these headline figures are methodological refinements that improve data quality, but complicate comparative analysis for researchers relying on historical trends.
Typically, all nationally representative surveys calibrate their sampling frames to the most recent population census and update them using Mid-Year Population Estimates. The MAPS data, South Africa’s most comprehensive consumer and media survey, covering over 20,000 interviews annually across all municipalities did this with its latest September release of data. The sample was drawn, correspondent collected followed by validation, testing and cleaning before its weighted back to this estimate of the South African population, aged 15+.
Owing to the undercount and concerns raised by statisticians regarding the accuracy of the 2022 Census data, the MRF chose not to update the MAPS data until those concerns were addressed. And while all the concerns regarding the Census have not been put to rest, subsequent research has supported the population increase, and national datasets have updated to the revised population. The resulting length of time between updates, resulted in far larger changes than usual, with an increase of just over 2 million people. Due to a concurrent adjustment in weightings, the variance in variables differs from the overall percentage change in population (see table below).
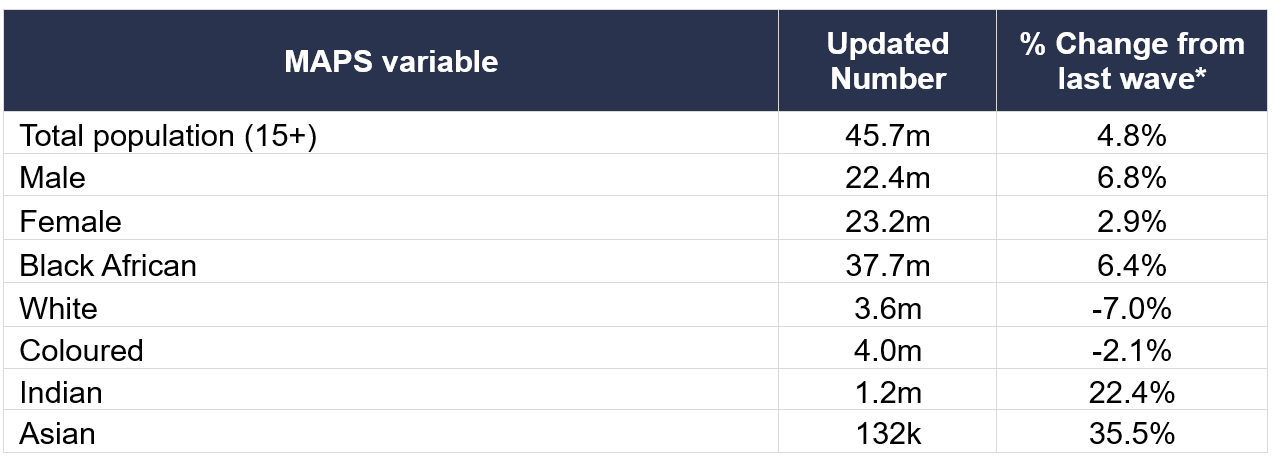
* Relative change in MAPS values from May 2025 wave to current September 2025 wave.
Since 2020, a recorded 18 quarterly releases, one of the key benefits of the MAPS data is it allows for quarter-on-quarter trend analysis across a four-year window. However, this latest release will cause short-term headaches for marketers and brand planners who will now see a change in their numbers, unrelated to their performance in the market.
For example, the number of people who say they ate at ChesaNyama in the last month, a QSR that is over-indexed to black consumers grew by more than 20%. While Mugg & Bean, indexed differently – grew by 5%. The ChesaNyama growth speaks more to the 6%+ increase in black and male population numbers, while the Mugg & Bean numbers are more impacted by the drop in the white population number.
|
From a long-term view, these same marketers and brand planners should have confidence that the numbers are tracking other large datasets and will be more reflective of the South African population, thus more reliable and accurate. The best way to mitigate against the short-term changes is to triangulate results by using percentages, proportions and indexing when doing comparative analyses and focus less on the absolute numbers.
Demographic Shifts: A look into the future of the country
The StatsSA 2025 Mid-Year Population Estimate provides a more measured view of demographic change compared to MAPS’s dramatic adjustment. This smoother data reveals several key trends shaping South Africa’s population. The StatsSA data highlights some demographic trends which will impact the future of the country:
- The racial distribution has not changed significantly and StatsSA’s latest figures show that Black Africans remain the majority at 82%.
- Women continue to outnumber men by 1.5 million due to a 5 year, on average, longer lifespan.
- The country’s age profile is also shifting: 26.2% of the population is under 15, while 10.5% is aged 60 and older. The fastest growing age group is 60+ because of two demographic shifts:
- Life expectancy at birth is estimated at 64.0 years for males and 69.6 years for females, reflecting gains in healthcare and HIV treatment access.
- Fertility continues to decline, with the Total Fertility Rate (TFR) dropping to 2.21, down from 2.78 in 2008.
- The declining fertility rate may signal a demographic dividend, allowing families and governments to invest more per child.
- Economic pressures are also responsible for this shift and are reshaping family formation, with many delaying or opting out of parenthood due to high living costs. The declining birth rate could affect future labour supply, prompting a rethink of education and employment strategies.
- The aging population also raises questions about pension sustainability, healthcare capacity and social support systems, areas that require long-term planning and investment.
- Urbanisation continues to accelerate, especially in Gauteng and Western Cape, which attract the most internal and international migrants driving demand for housing and services.
“If your job is to provide consumer insights, it is important to not only use the correct datasets but also use them in the correct way. Understanding demographic transitions, coupled with wise interpretation will provide the best data-driven insights” says Eighty20.