Suburb Profiler
Eighty20’s Suburb Profiler helps clients understand the areas where their customers live, work and play. It offers insight into the diversity and potential of neighbourhoods across South Africa by allowing clients to drill down into specific adult target markets and understand where they live, what they look like and how they behave.
What is the Suburb Profiler?
The Suburb Profiler takes Eighty20’s most up to date location-based population data and overlays it with our proprietary ENS solution, enabling areas to be profiled not only by demographics, but by over 200 other variables including financial behaviour, asset ownership, retail consumption, media usage and digital adoption. The solution is available as an online dashboard and a raw data extract. It can be used in 2 primary ways:
External Data Only
Detailed profiling at a sub and main place level, with metrics sourced from our ENS
Overlay Internal Customer Data
This solution overlays aggregated client internal customer metrics to provide a blend of ENS and internal transactional metrics
What problems can the Suburb Profiler solve?
Eighty20 has developed the Suburb Profiler to help businesses better understand the profile of customers living in different areas. Given Eighty20’s deep experience in market research we have combined the best datasets available to impute detailed profiling of neighbourhoods across South Africa. The Suburb Profiler can help businesses:
Understand customers living or working in an area, or around certain points of interest
Identify existing stores serving a certain profile of customer and compare the customer profiles between different stores
Identify areas with a certain profile of customer to help inform your new site strategy or where increased penetration could be possible
Some use cases we have helped work on:
- Identifying areas where a business’s target customers live but where it does not have good market share
- Helping banks determine the customer segments that their ATMs serve compared to their competitors’ ATMs and identify gaps
- Help identify neighbourhoods that can afford and may want certain services, such as fibre
How it works?
The Suburb Profiler has the following functionality:
- Map and detailed table view
- Over 200 ENS variables to choose from
- Reporting of metrics on Sub Place and Main Place location level
- Filter by ENS segment, and up to three chosen variables
- Quickly and intuitively extract insights on consumers living in particular areas.
And with the addition of your company internal data, the following can also be achieved:
- Visualise metrics and changes in metrics in a mapped view and detailed in table view
- Index internal customer ENS metrics against the overall population in an area
- Filter by customer type and category.
View it in two different ways – Map and Table View
Visualising a large number of consumer metrics by location, in an easy-to-understand, digestible manner is challenging. The Suburb Profiler overcomes this challenge by presenting this wealth of data in two different ways: through a Map View and detailed Data Table view.
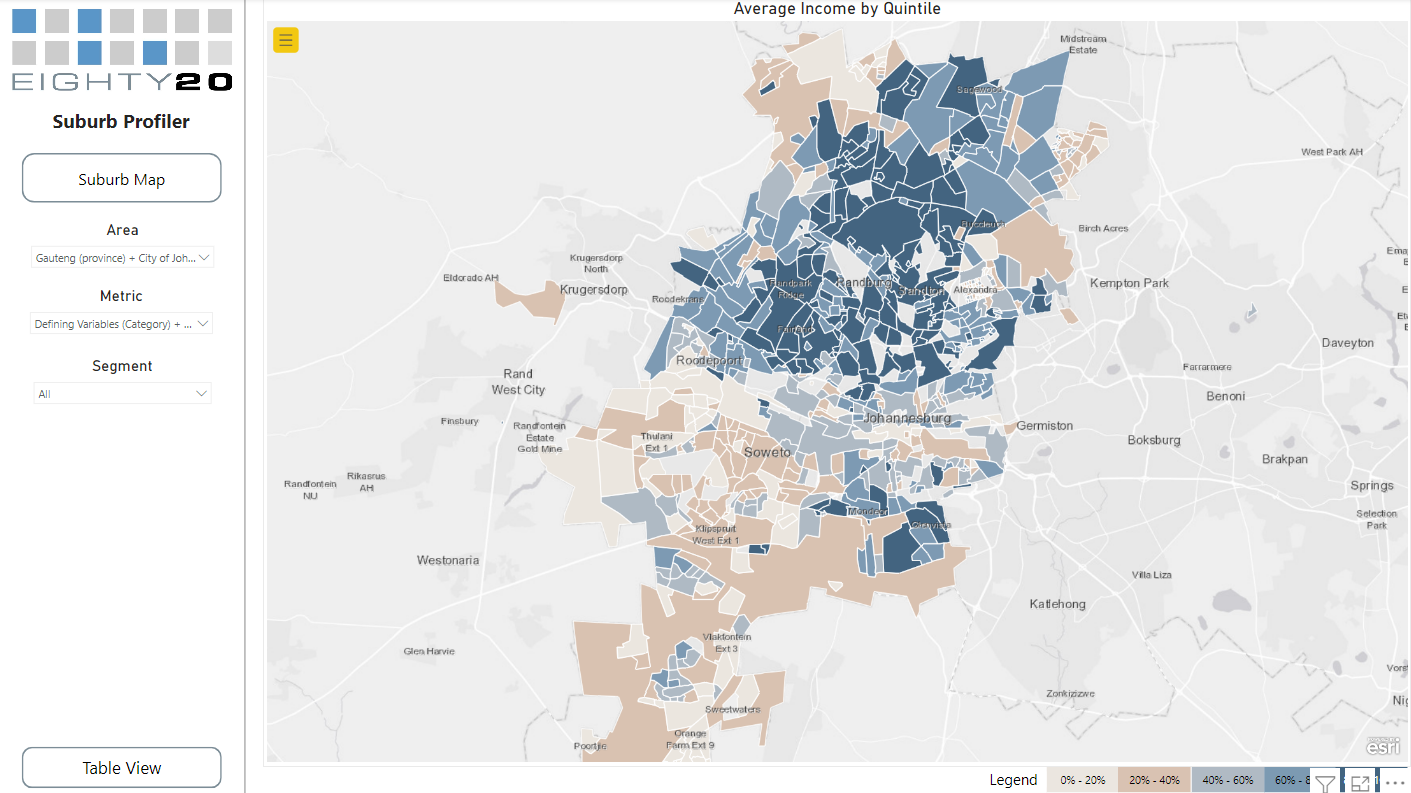
Map view:
The Map View uses a heat map to categorise all sub places in a municipality into quintiles for any selected metric. This view enables the selection of a municipality of interest (one location level smaller than province), the selection of the metric of interest, and the consumers’ ENS segment.
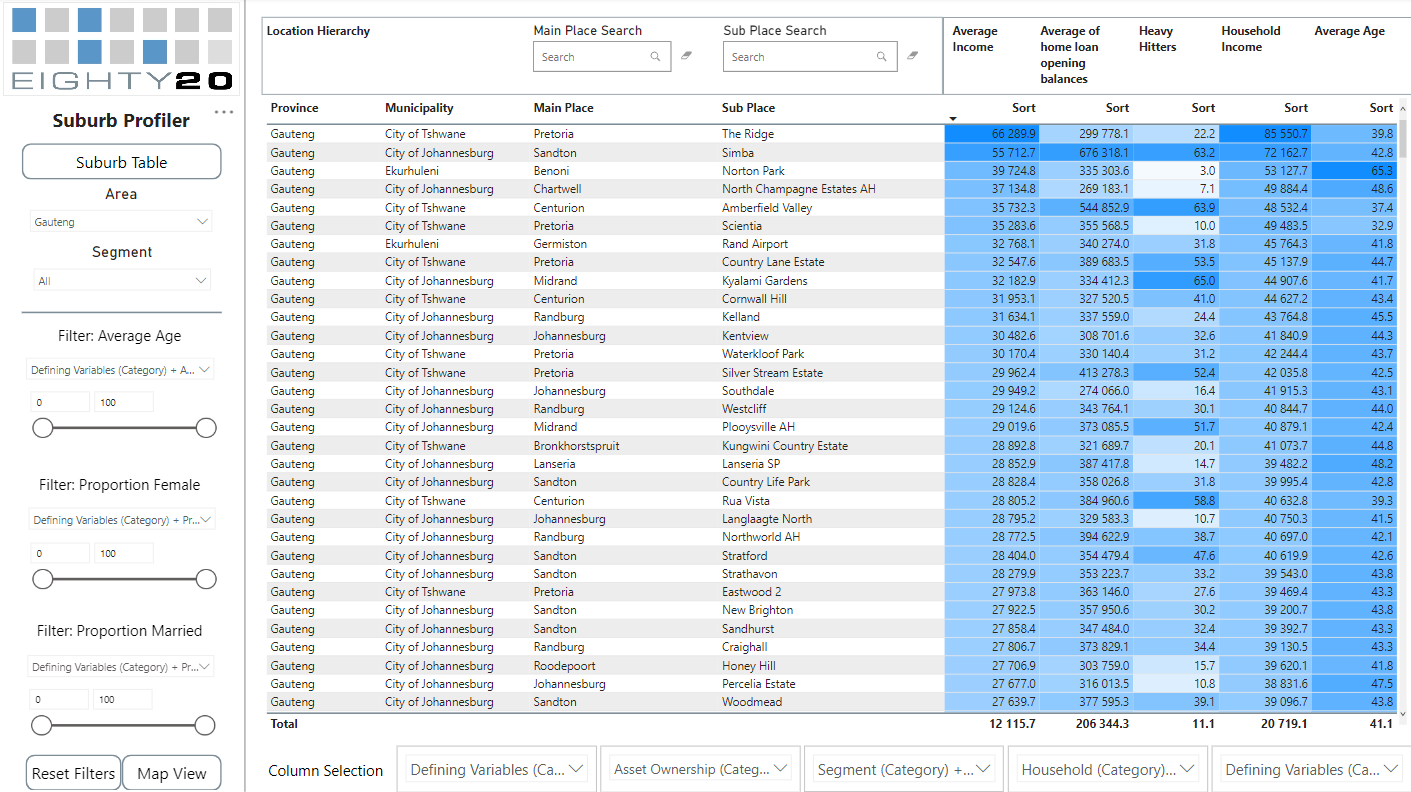
Table view:
The Table View contains the complete location hierarchy, from province to sub place, and allows the selection of up to five metrics to display at once in an easy to use table format. This view enables the selection of the area of interest, the selection of five metrics of interest, and the selection of the consumers’ ENS segment.
Intuitive flexibility in viewing the data
These two simple views provide intuitive flexibility when extracting the information required on any area across South Africa. The tool can enable users to answer specific questions on the profile and behaviour of consumers in South Africa, such as:
- What are the sub places in the entire country that have the highest population density, fall into the top quartile of the probability of having credit cards, fall into the top quartile with respect to average personal income, and use the internet daily? or
- How many people are characterised by low overall retail spend affluence, spend the most at Shoprite for groceries, and live in sub places in the Cape Town main place?
The Suburb Profiler provides valuable insights enabling users to understand how their business is performing by area; how best to expand their footprint, or; how to better refine their value proposition by area based on the profiles of customers. If these or other location based insights are necessary to help grow your business and better engage with customers, then the Suburb Profiler could be the right solution.
Eighty20’s Data Products can solve your customer insights needs
Businesses know that effective marketing begins with understanding their customers, and as a result, spend significant money on internal analysis, customer research and external market research to gain this understanding. The challenge is often that the internal and external views of the customer are separate and company insights and knowledge are often incomplete – scattered throughout the organisation. The result is that all this hard-earned, expensive research doesn’t improve over time and is not well used. Eighty20 has developed several online data products to assist with this: the Data Portal, Credit Portal, the ENS Customer Profiling Tool, The Terain Customer Movement Data Platform, and now, the Suburb Profiler.