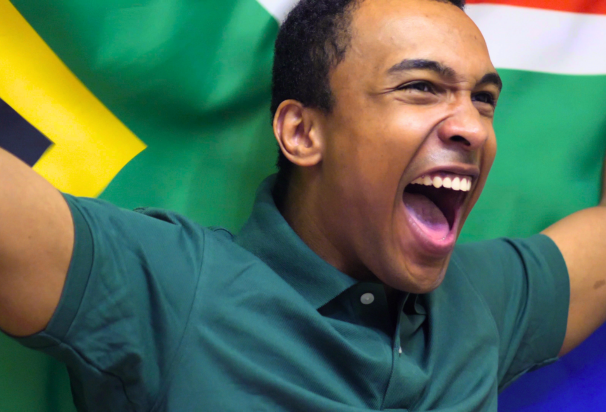
January 31st, 2008
In the formal employment sector, the construction sector has had the highest annual growth rate (11.5%) from 2001 to 2006. For the same period, the mining sector declined at a rate of 6.4% per annum. (Labour Force Survey, September 2006)
This week’s theme: Segmenting South Africa
January 30th, 2008
Segmenting South Africa’s households by main source of income, almost a quarter (24%) rely on pensions and grants as their main source. 11% rely on remittances. (GHS 2006)
This week’s theme: Segmenting South Africa
January 29th, 2008
More than half (53%) of black multiple person households include extended family and non-relatives. For white households, this figure is 13%. (GHS 2006)
This week’s theme: Segmenting South Africa
January 28th, 2008
77% of black households in South Africa consist of more than one person. Of these, 53% include extended family or non-relatives (GHS 2006)
This week’s theme: Segmenting South Africa
January 25th, 2008
The number of employees in the mining and quarrying industry in South Africa in 1935 was 400,274. In 2006 it was 458,506. It peaked in 1987 at 763,319 (StatsSA: SA Statistics, 2007)
This week’s theme: Population clocks and growth rates
January 24th, 2008
In 2007, 80% of South African households used electricity as their main source of lighting. In 1996 the proportion was 58%. (Community Survey 2007, Census 1996)
This week’s theme: Population clocks and growth rates
January 23rd, 2008
The number of white household with a household income of R10,000 or more has experienced an average growth rate of 4.4% per annum since 2003. For all other population groups combined, the figure is 24.4%. (AMPS2003, AMPS2007)
This week’s theme: Population clocks and growth rates
January 22nd, 2008
Between 1970 and 2005 total employment in South Africa grew by 1.3% per year. Over the same period the population aged 14 65 grew by 2.68% per year (NBER working paper 13167, June 2007)
This week’s theme: Population clocks and growth rates
January 21st, 2008
South Africa’s population has grown by 8.2% over the past six years (compounded annual growth rate of 1.3%). For Indians/Asians, the figure is 11.6% (1.8% CAGR), the highest of all the population groups. (StatsSA 2001 Census, 2007 community survey)
This week’s theme: Population clocks and growth rates
January 18th, 2008
Around 400 000 children attend private schools in SA. This amounts to roughly 2.7% of all learners. (Private Schools South Africa, GHS 2006)
This week’s theme: Back to school